Proprietary Data and Chart Studies
Proprietary Data and Chart Studies deliver advanced market insights through metrics like Gamma Exposure, Net Options Delta, Options Dollar Flow, Dark Pool Levels, and detailed Net Options Premium and Contracts both total and 0DTE offering a deeper view of market positioning and sentiment.
Gamma Exposure (Total and 0DTE)
Gamma Exposure (GEX)
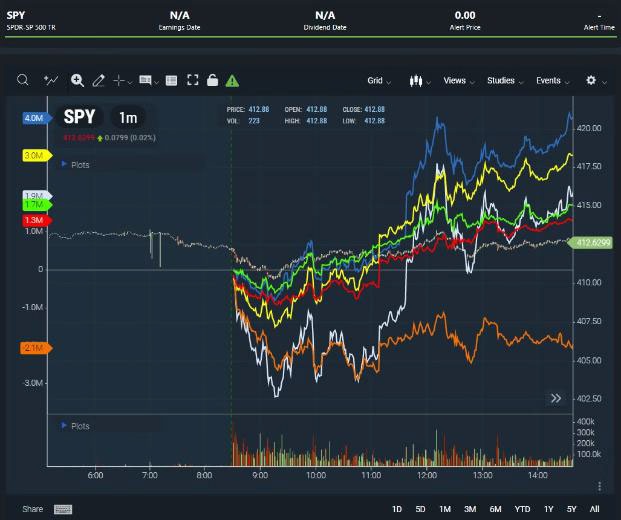
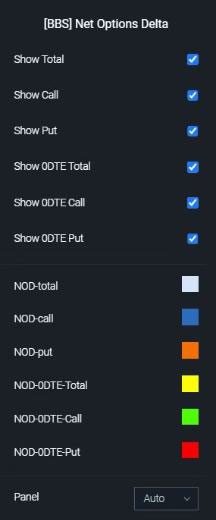
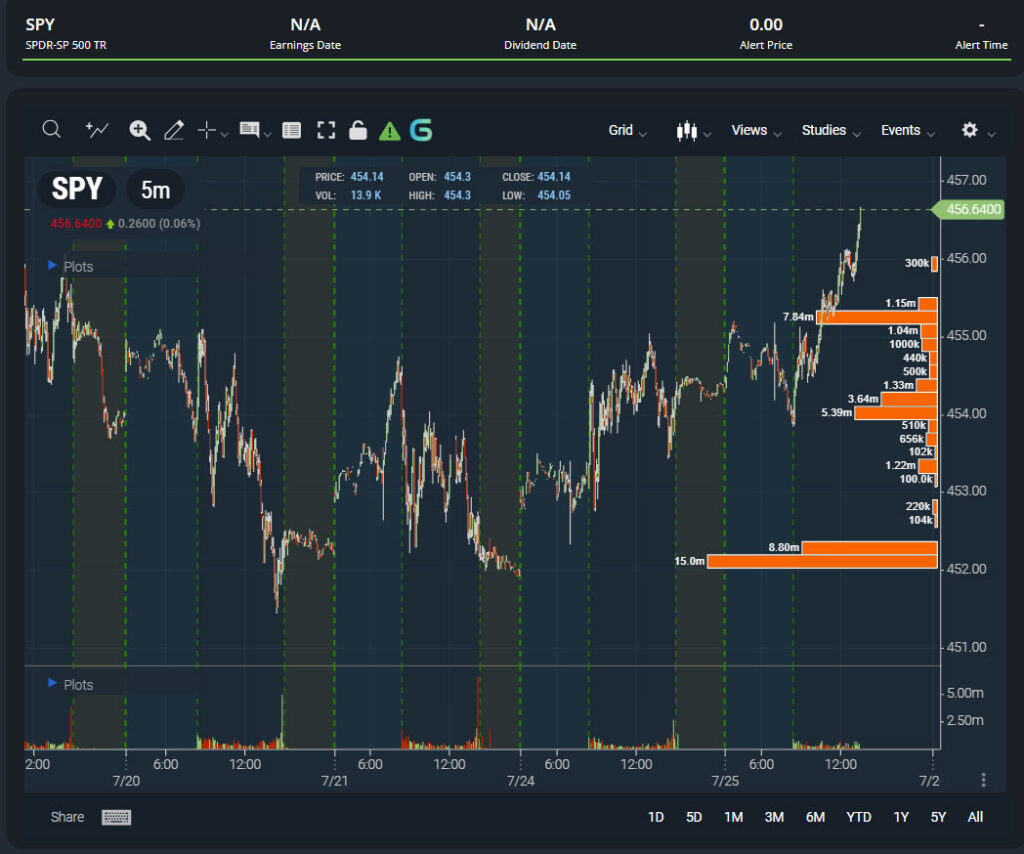
Net Options Delta (Total and 0DTE)
This BlackBox proprietary study shows you the daily Net Options Delta on a ticker. The delta of a net options position is the ratio of the change in the value of the position to the change in the price of the underlying asset. In other words, it is a measure of how much the value of the options position will change for a small change in the price of the underlying asset. This study is broken down into 6 colors:
- White-NOD Total, this takes the total of the Put/Call Delta
- Blue-Call Delta, if the blue line is going up then calls are being bought, if blue is going down then calls are being sold.
- Orange-Put Delta, if the orange line is going down then puts are being bought, if the line is going up then puts are being sold.
- Yellow/ Green/Red the same logic as White/Blue/Orange with the only difference being it only tracks the contracts that expire that day (O DTE, days to expiration)
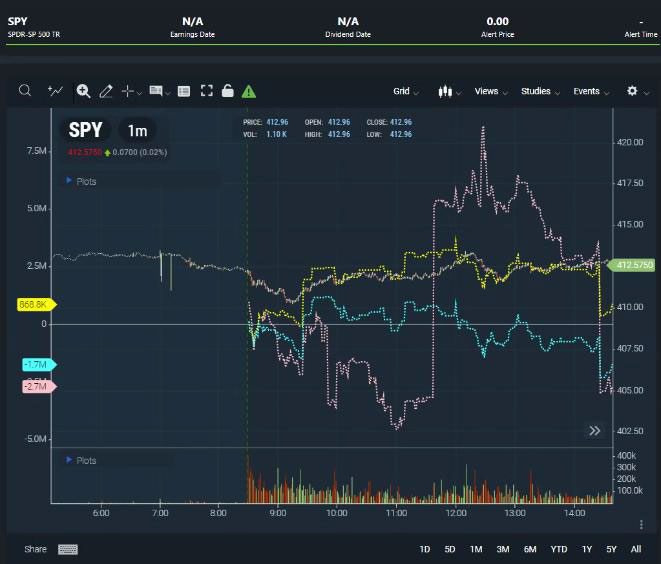
Options Dollar Flow
Options dollar flow is a metric that measures the net flow of money into or out of options contracts.
It is calculated by taking the difference between the total premium paid for call options and the total premium paid for put options. Positive dollar flow indicates a bullish sentiment, where in turn a negative dollar flow would indicate a bearish sentiment.
- This proprietary BlackBox study breaks down the dollar flow into three categories:
- DF-Total (Pink) Calculates the dollar flow for all options contracts expiring today to infinity.
- DF-week (Yellow) Calculates the dollar flow for all options contracts that expire within the next 7 days.
- DF-month (Blue) Calculate the dollar flow for all options contracts that expire within the next 30 days
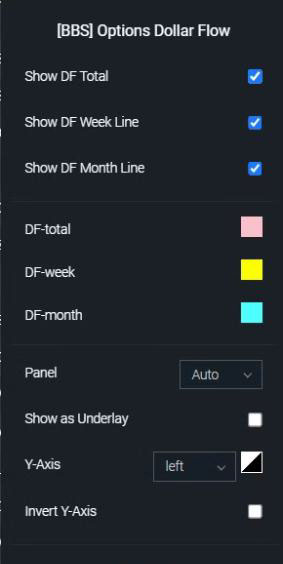
Dark Pool Levels
Options dollar flow is a metric that measures the net flow of money into or out of options contracts.
It is calculated by taking the difference between the total premium paid for call options and the total premium paid for put options. Positive dollar flow indicates a bullish sentiment, where in turn a negative dollar flow would indicate a bearish sentiment.
- This proprietary BlackBox study breaks down the dollar flow into three categories:
- DF-Total (Pink) Calculates the dollar flow for all options contracts expiring today to infinity.
- DF-week (Yellow) Calculates the dollar flow for all options contracts that expire within the next 7 days.
- DF-month (Blue) Calculate the dollar flow for all options contracts that expire within the next 30 days
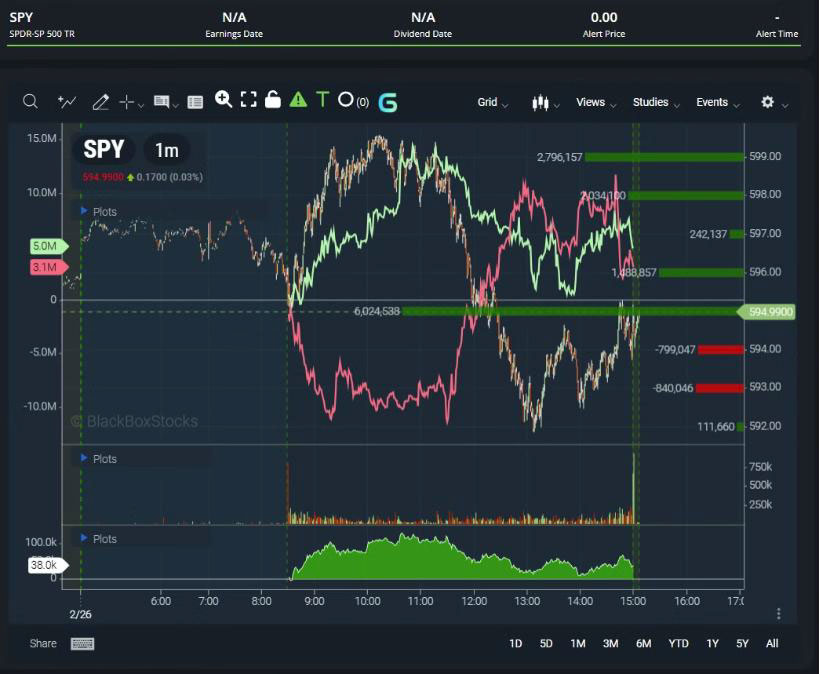
Marketwide Net Options Premium (Total/0DTE) And Net Contracts
Net Options Premium is similar to Options Dollar Flow, but considers all options and also removes multi-leg trades. Calls on the ask are positive and puts on the ask are negative while calls on the bid are negative and puts on the bid are positive. You can access both all options and ones expiring the same day (0DTE)
Net Contracts are the same as premium just only counting the total contracts.
Stock Net Options Premium (Total/0DTE)
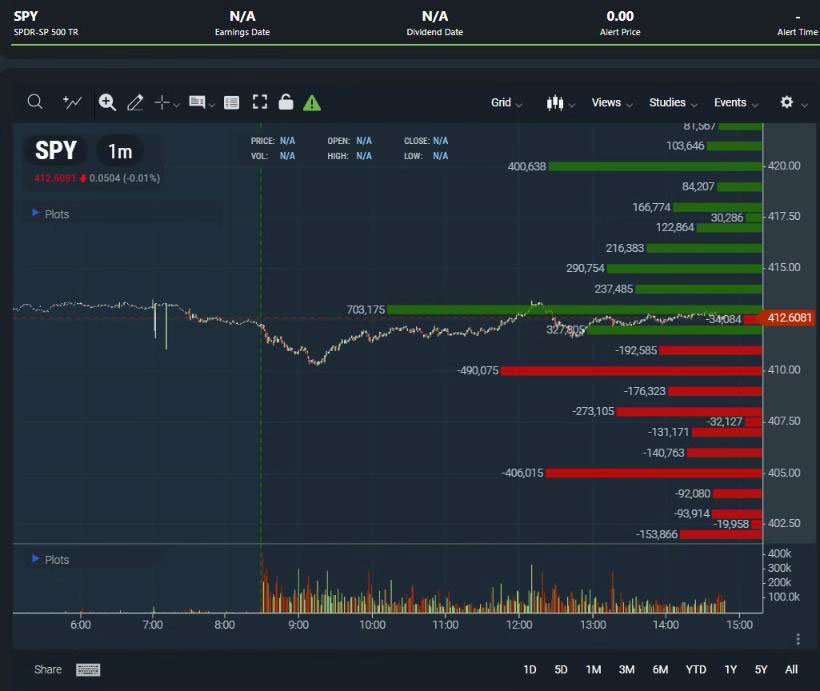
Stock Net Options Premium by Strike (Total/0DTE)
Stock Net Options Contracts
Net Options Premium is similar to Options Dollar Flow, but considers all options and also removes multi-leg trades. Calls on the ask are positive and puts on the ask are negative while calls on the bid are negative and puts on the bid are positive. You can access both all options and ones expiring the same day (0DTE)
Net Options Premium by Strike let you see each level.
Net Contracts are the same as premium just only counting the total contracts.